 List
List Abstract
 One+Abstract


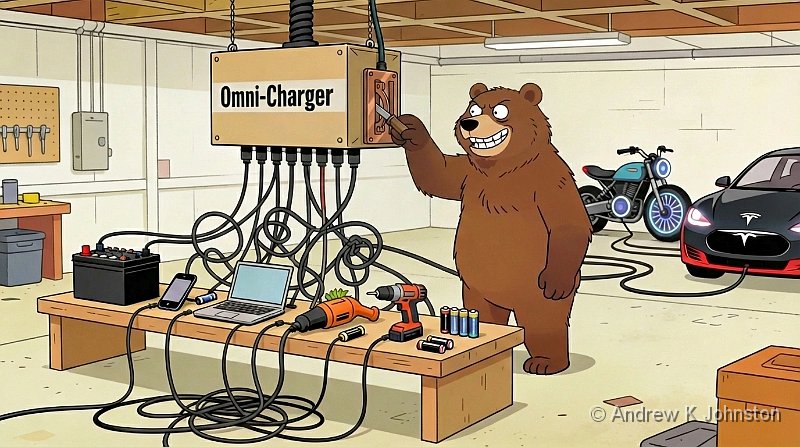
| Omni-charger |
I spent much of the last few years working on a large company’s Net Zero project, within which a significant element of my role was trying to educate people to understand electrical power and emissions calculations.
It was hard enough training those without much scientific background to understand power in Watts, energy in Watt-hours, and their various standard multiples in SI units. At least the relationship between power and energy is a straightforward one.
However once we started talking about energy stored in and used from batteries, we encountered a whole new level of complexity. That’s because contrary to common sense, battery drain and capacity are almost always quoted not in Watts and Watt-Hours, but in Amps and Amp-Hours. Amp-hours (Ah) are a measure of the current flowing through a circuit, multiplied by (or, strictly, integrated over) time. If a steady current of 1 Amp flows for 1 hour, that’s one Amp-hour. If that circuit consuming 1A is powered by a battery marked 10Ah, then you know the battery should be able to power it for 10 hours.
So far so good. If you know the current drain, and everything runs at the same voltage, you can do these calculations easily. Older car electrics which all work at 12V are a standard example. Then there’s a great sequence in Apollo 13 where Ken Mattingly (played by Gary Sinise) sits in the simulator and experiments with sequences to wake up the stricken craft to find one which fits the capacity and the maximum current of the usable fuel cells, using just an ammeter.
The Amp-hour model breaks down
Unfortunately it all rapidly breaks down in our modern world of multiple battery technologies, with varying loads and voltages.
Here’s a simple example. I have a powerbank battery, which is marked 20Ah. I want to use it on a trip to recharge my drone batteries. According to Google the DJI Mini 3 Pro uses batteries with a 2453 mAh (≈ 2.5Ah) capacity. How many batteries can I recharge, and how long should it take?
You might think that the answer to the number of batteries is 20/2.5 = 8. But it’s not that, or anything remotely like it. That’s because the quoted Amp-hour figure is "at a certain voltage". Change the voltage and you change the Amp-hour capacity.
If you’re not sure about this, think about two AAA cells each with about 1Ah capacity. Wire them up in series and you get a voltage of 3V, but only 1Ah can flow (the same current flows simultaneously through both). Wire them in parallel with a switch between them, the output voltage is 1.5V but you’ll get 1Ah out of each in turn, so 2Ah in total.
The problem with the powerbank and drone batteries is they have different native voltages, and 1Ah therefore represents a different amount of power in each case.
OK, so I’ve convinced you that we should think about power/energy rather than current. Well Power = Voltage * Current, so that should be easy, right?
Sadly not. Google helpfully confirms that "the DJI Mini 3 Pro uses 7.38V Li-ion Intelligent Flight Batteries, with a maximum charge voltage of 8.5V". So what voltage should we use? 7.38V, 8.5V, something in between? Fortunately a bit more Googling confirms that that the batteries have an energy capacity of 18.1 Wh, so working backwards we get a voltage of 18.1 / 2.453 = 7.38, so that’s the right one, but you could easily get it wrong.
It gets even more confusing with the powerbank. They don’t sell exactly the same model any longer, but the closest replacement supports output voltages of 4.5V, 5V, 9V and 12V. At which of these voltages is the Ah figure quoted? It turns out to be none of them. Hidden away in the 2pt text in pale grey on the bottom of the battery is the capacity in energy terms, 74Wh. Working backwards, that tells us that the Ah figure is quoted at 74 / 20 = 3.7V, which isn’t actually an output voltage. In this case we’re entirely dependent on the battery manufacturer providing a Wh figure. In fairness to Romoss their newer adverts all do, but they still use the almost meaningless Ah number as the "hero" figure. Many other manufacturers don’t bother – I couldn’t find a Wh figure for any of a random sample on Amazon.
Now we have two energy figures in Wh, we can finally answer my first question. The ratio between powerbank capacity and drone battery capacity is 74 / 18 = 4.1. It’s not actually going to be that good, because charging one battery from another is nowhere near 100% efficient, but 3 charges might be achievable, and that’s what I saw in practice.
The "how long should it take" question is a bit more tricky, as we don’t know exactly what voltage the two batteries will negotiate over USB-C. 9V is closest to the 7.4V of the DJI batteries, and Romoss also usefully state that the powerbank can deliver 2.2A at that voltage. A full charge is 18Wh. 9V x 2.2A is about 20Wh, but let’s assume about 75% efficiency like with the capacity figures. That suggests a full charge time of just over an hour, again matching my experience.
Another example
Once you’re alert to all this you find other examples everywhere. I have a number of Wifi-enabled water detectors in the house. I noticed that immediately after putting in freshly-charged Duracell rechargeable batteries, they report a battery level of ~67%, and the batteries don’t last as long as expected. Why?
The answer is that 1.5V does not equal 1.5V. Well it does, but what different manufacturers and technologies deliver as a "1.5V" battery varies widely.
Out with my trusty AVO meter, like me in its 7th decade, and still running on its original battery. Impressive. Let’s look at 3 AA cells in my battery drawer:
- Duracell NiMH rechargeable battery. Output 1.3V unloaded. Stated capacity 2500mAh @1.2V, so energy capacity 2.5 * 1.2 = 3Wh
- Varta Longlife alkaline battery. Output 1.5V. Published capacity 2750mAh, so energy capacity 1.5 * 2.75 = 4.1Wh
- Hixon Li-ion battery. Output 1.5V. Stated capacity 3500mAh, so energy capacity 1.5 * 3.5 = 5.25Wh
Clearly the combination of low voltage and low capacity of the NiMH batteries explains their relatively short life between charges. Unfortunately the Li-ion batteries are dramatically more expensive and I’ve had a few reliability issues, otherwise they’d solve a lot of problems.
Is the Amp-hour completely useless?
Current is easy to measure. Almost as soon as we’d realised that current flowing through a coil produces a magnetic field, we added a magnet and a spring and created a meter which could measure current. Add a resistor, and you could measure voltage. Add some diodes and a capacitor and you could do the same tricks with alternating current.
Power is much more difficult to measure directly. In reality most of the time we measure current and (if we don’t know it) voltage and do the multiplication sum.
If you’re working with a sealed system then current and Amp-hour figures may be good enough. As I noted above, generations of electricians have operated that way. For a lot of purposes I don’t care what the voltage of my phone’s battery is: I can see the current drain over time with an app like AccuBattery, and I can work out how that matches the battery’s capacity in Ah. However as soon as you have to interface with external elements (e.g. "how many times can my powerbank charge my phone?") this breaks down.
Unfortunately the market is following tradition, in an environment where the tradition is no longer applicable. Why do powerbank manufacturers think it’s acceptable to quote an Amp-hour capacity tied to a mysterious internal voltage which isn’t even one of the options on the output? As a start, let’s try to quote stored energy figures in Wh as well, but in time they should become the primary figure, with the Ah consigned to a secondary role.


 Email me
 Others
 Main feed (direct XML)