Combining Risk Factors
In "Waltzing with Bears" Tom DeMarco and Tim Lister introduce the very useful concept of the "Uncertainty Diagram", the probability distribution for project metrics such as delivery date, expenditure or benefit delivery. This is used, for example, to assess the likelihood of delay from a given risk.
However, when it comes to evaluating the net effect of several risk factors they rely entirely on Monte-Carlo simulation, claiming that the mathematics for an analytical solution are too complicated. While this might be true for complex curves, it isn't true where the curve is defined by, or can be approximated by, a few discrete points, which will be a common case in practice. Here's my attempt to show how this can be explained, and how a relatively simple analytical solution can then be used in place of simulation.
Consider the following two uncertainty diagrams, which show how two separate risk factors, Factor 1 and Factor 2, will affect a project's completion date relative to the earliest possible completion date.
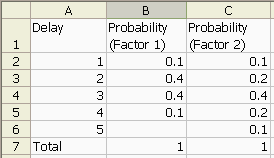
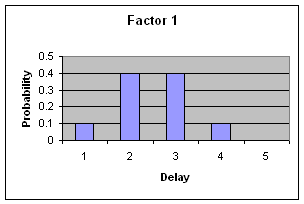
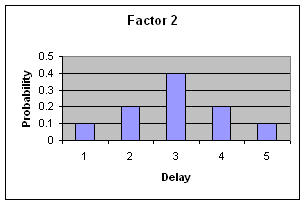
(For simplicity we refer to delivery after the earliest possible date as a "delay", although a good project manager will actually agree a realistic target later than the earliest possible date.)
We want to combine these two profiles into a single probability function (which can then be expressed as an uncertainty diagram).
Consider the first value in each distribution, the probability of delivery up to one month after the earliest possible date. If Factor 1 affects the project so that there is up to one month's delay AND Factor 2 affects the project so that there is up to one month's delay then delivery will be delayed up to 2 months. This is the smallest net delivery delay we can assess. Note the use of the word "AND". This means we simply multiply the probabilities for those two cases, giving a net probability of 0.01.
Delivery delayed between two and three months means that either Factor 1 produces one month's delay AND Factor 2 produces two month's delay OR Factor 1 produces two month's delay AND Factor 2 produces one month's delay. Again, we multiply appropriate pairs of individual probabilities, then add the results together (where we use the word "OR").
The following spreadsheet shows the formulae for all the possible outcomes:
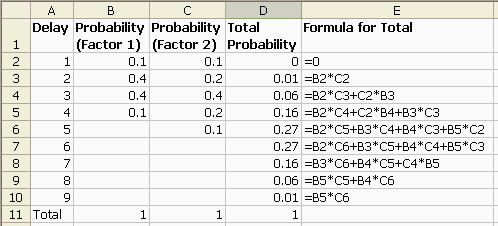
The right-most column is our net probability function, which can then be plotted as an uncertainty diagram:
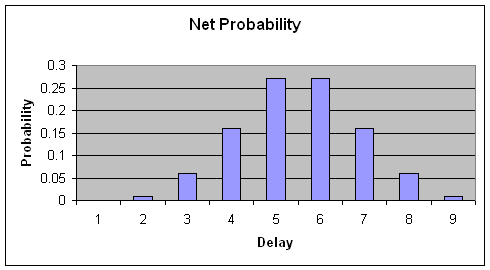
In summary, as long as the two factors are independent (which is also the underlying assumption for the simulation approach) you can combine them using simple probability rules. To produce a single net uncertainty diagram they need to be in the same units, but you could produce a list, for example, showing probabilities like "the probability of two month's delay and $10,000 budget overrun".
I haven't found a way of doing this using simple Excel functions, but it would be very straightforward to write a small VBA routine to dynamically build the formulas given the input columns. I may have a go at this in a future version of this paper.
Click here to download the example spreadsheet.
Comments
3 Responses to Combining Risk Factors
John Burgess on 22 June 2010 at 21:23
There is an underlying assumption to what you are doing that the risks impact in series rather than parallel. While this is clearly the safest (i.e. most conservative) assumption to make, I feel it does need to be made explicit.
It is certainly possible to imagine situations in which risks impact in parallel – the opening of the channel tunnel rail link could have suffered from both from problems with the earth under the channel and difficulties getting planning permission for the rail lines to the tunnel. However, these should probably have impacted in parallel and so the combined impact would be simply the greater of the two rather than the sum.
Andrew on 22 June 2010 at 21:28
I agree that there are a number of possible ways to combine the risks. My point is that it is possible to use analytical rather than simulation-based techniques, and I think John’s analysis supports that.
Robert on 12 May 2021 at 18:59
Hi. I know, old thread, but it came up in a google search. I was looking for ways to combine multiple risk factors. this was helpful, thanks.
Incidentally, you can use a formula like this: =SUMPRODUCT(B$2:B5*SORTBY(C$2:C5,ROW(C$2:C5),-1)) to automate the math. Thats for total probability on the Delay line 5. it can be copied up and down with a 0 for delay line 1. not sure if this was available in 2010. but definitely in 2021. I had many many lines to calculate so an automated formula was essential.
thanks!
If you'd like to comment on this article, with ideas, examples, or just to praise it to the skies then I'd love to hear from you.
 Thoughts on the World (Main Feed)
 Main feed (direct XML)